So you loved that Stuff You Should Know (SYSK) episode on The Dyatlov Pass Mystery, and want to know which other episodes Josh and chuck have that might be similar? Well with over 1500 episodes, it can be hard to choose.

This project uses latent dirichlet allocation (LDA), a natural language processing (NLP) technique, to analyse topics within SYSK episodes and provide similar episode recommendations.
Full SYSK Transcripts generously provided by OSF1.
All the source code for this project can be found on my github.
Checkout the final streamlit recommendation app here!
Transcript storage
I first use pandas to read the provided parquet files and subsequently write them to a local postgresql database. The files are lazily evaluated so no more than a single parquet file is held in memory at a single time.
Storing the files in a database allows for easy access for the rest of the project.
Some Stats
- Dataset consists of 2044 episodes in total
- Average length of transcript: 35,485 words
- Total of 72,531,340 words in the entire corpus
Text Preprocessing
Preprocessing is generally the most important and labour intensive part of natural language processing and in broader machine learning and this project is no exception. I used three popular NLP packages to undertake preprocessing: spacy, nltk, and gensim. This involved:
- Removing stopwords and punctuation. I append my own custom stopwords (contained in “custom_stopwords.txt”) to spacy’s built in stopwords. These custom stopwords generally consist of common SYSK sponsors, and Josh and Chuck’s full names.
- Lemmatization. I use NLTK’s WordNetLemmatizer to reduce the words to their lemmas.
- I then reduce the corpus’ size by extracting noun chunks.
- Next I extract and append bigrams from the documents.
- Common and rare words are then removed from the corpus. Generally, words that are very common (appearing in more than 75% of documents) do not add any useful information to topic modelling. Additionally, words that occur in very few documents are to rare to be clustered into topics.
- Finally, a bag of word representation for each document is generated for LDA modelling.
LDA Modelling
The preprocessed text is then put through a gensim LDA model. There are several parameters to tune here, although most importantly is the number of topics to sort the corpus in to. Additionally, I varied Gensim’s alpha and eta (traditionally called beta in LDA literature) values, and found optimal results with alpha set to auto and eta set to symmetric. A nice write up on the effect of these hyperparameters can be found here.
Optimizing number of topics
Determining the optimal number of topics to use is tricky. I have used two different metrics to attempt optimize coherence: $C_v$ and $C_{UMass}$, the exact mechanism of how these metrics determine coherence between documents can be found in the original paper. Essentially we are looking to maximise $C_v$ and minimise $C_{UMass}$. The results for various number of topics, up to 250, can be seen below:
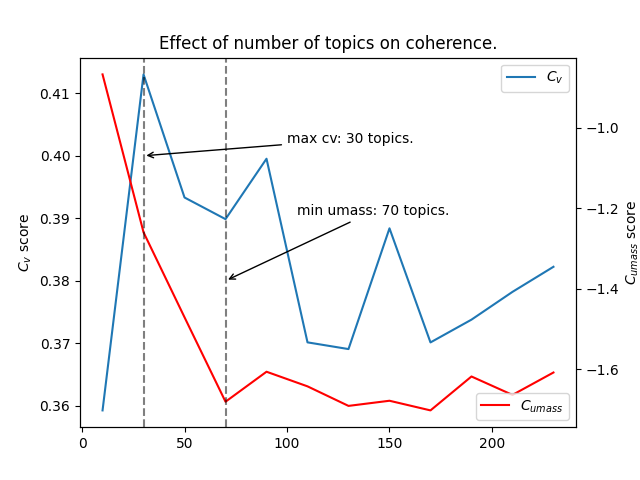
After trialing both 30 topics (max $C_v$) and 70 topics (min $C_{UMass}$), best results were seen with 30 topics, therefore this value was taken forward for further analysis.
Results Analysis
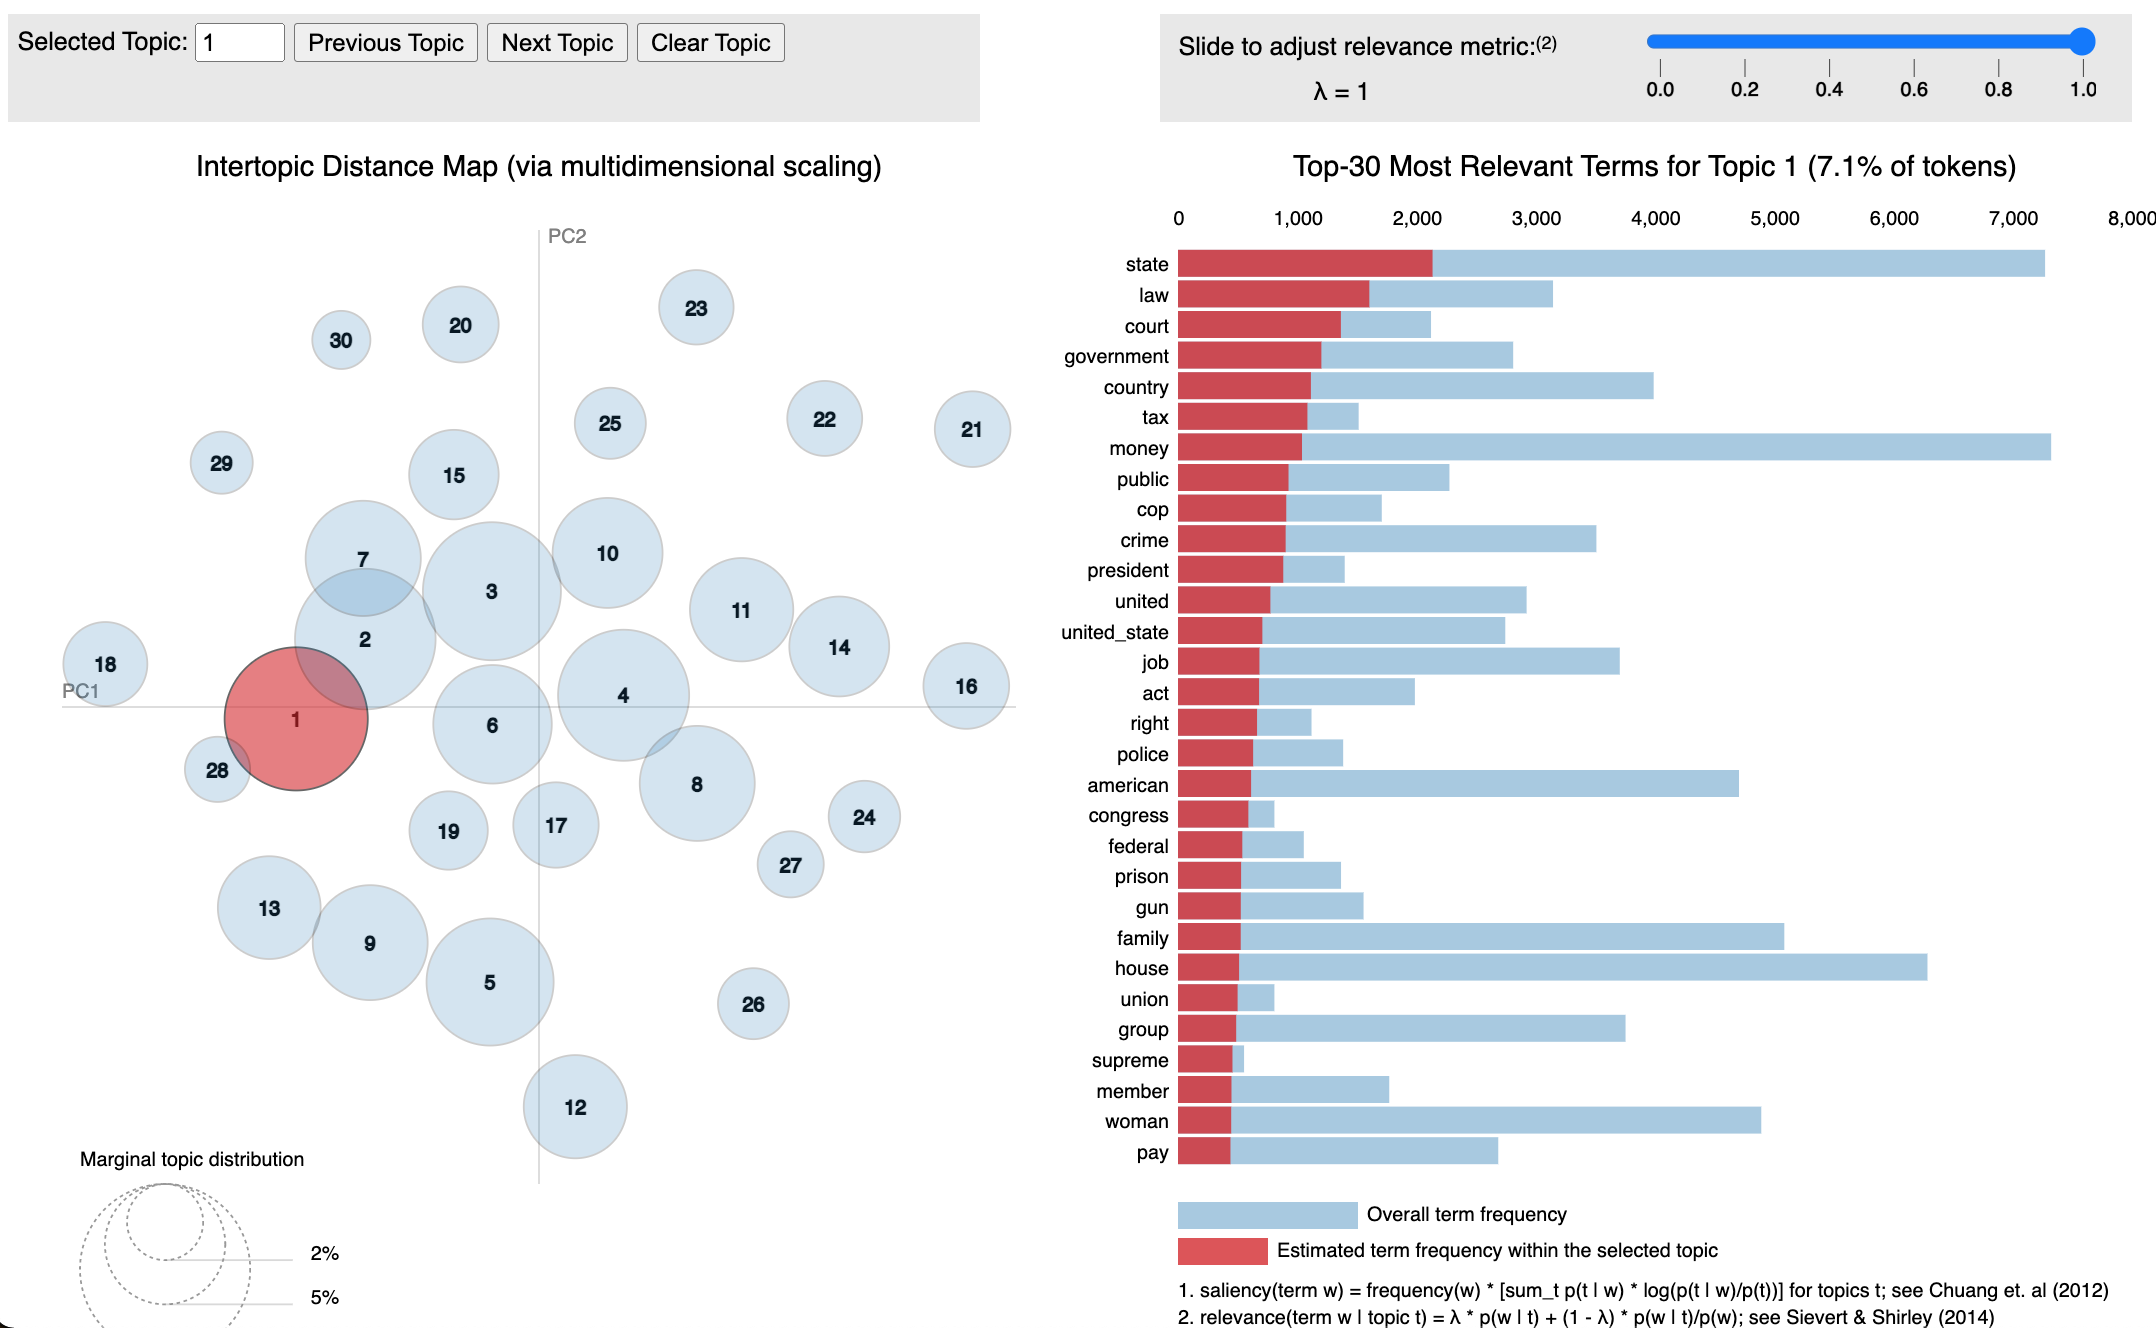
After determining the optimal number of topics and rerunning the model using this value, the results were analysed using pyLDAvis. The results form pyLDAvis are broken down into the topic bubbles and bar charts, reading the results can be summarised as follows:
Topic Bubble:
- The representation includes topics distribution in the 2-dimensional space (left side panel).These topics are represented in the form of bubbles.
- The larger the bubble, the more frequent is the topic in the documents.
- A topic model with a low number of topics will have big non-overlapping bubbles, scattered throughout the chart whereas, the topic model with a high number of topics, will have many overlapping small size bubbles, clustered in the chart.
- Distance between the topics is an approximation of semantic relationship between the topics.
- The topic which shares common words will be overlapping (closer in distance) in comparison to the non-overlapping topic.
Horizontal Bar Graph:
- The bar graph shows the frequency distribution of the words in the documents (color: blue).
- The red shaded area describes the frequency of each word given a topic.
- On selecting a topic (clicking on a topic bubble), top 10 words (with the red-shaded area) are shown.
- Hovering over the specific words (in the right panel), only the topic containing the words are visible. The size of the bubble in this scenario describes the weight age of the word on that topic. Higher the weight of the selected word, larger will be the size of the bubble.
Generally, we want to see large topic bubbles with little to no overlap.
The full interactive version can be found explored below: (you may need to refresh the page)
The first topic can be seen to be generally around the government and laws, particularly in the United States.
Whereas the fourth topic aligns with the human body, animals, and natural/living things.
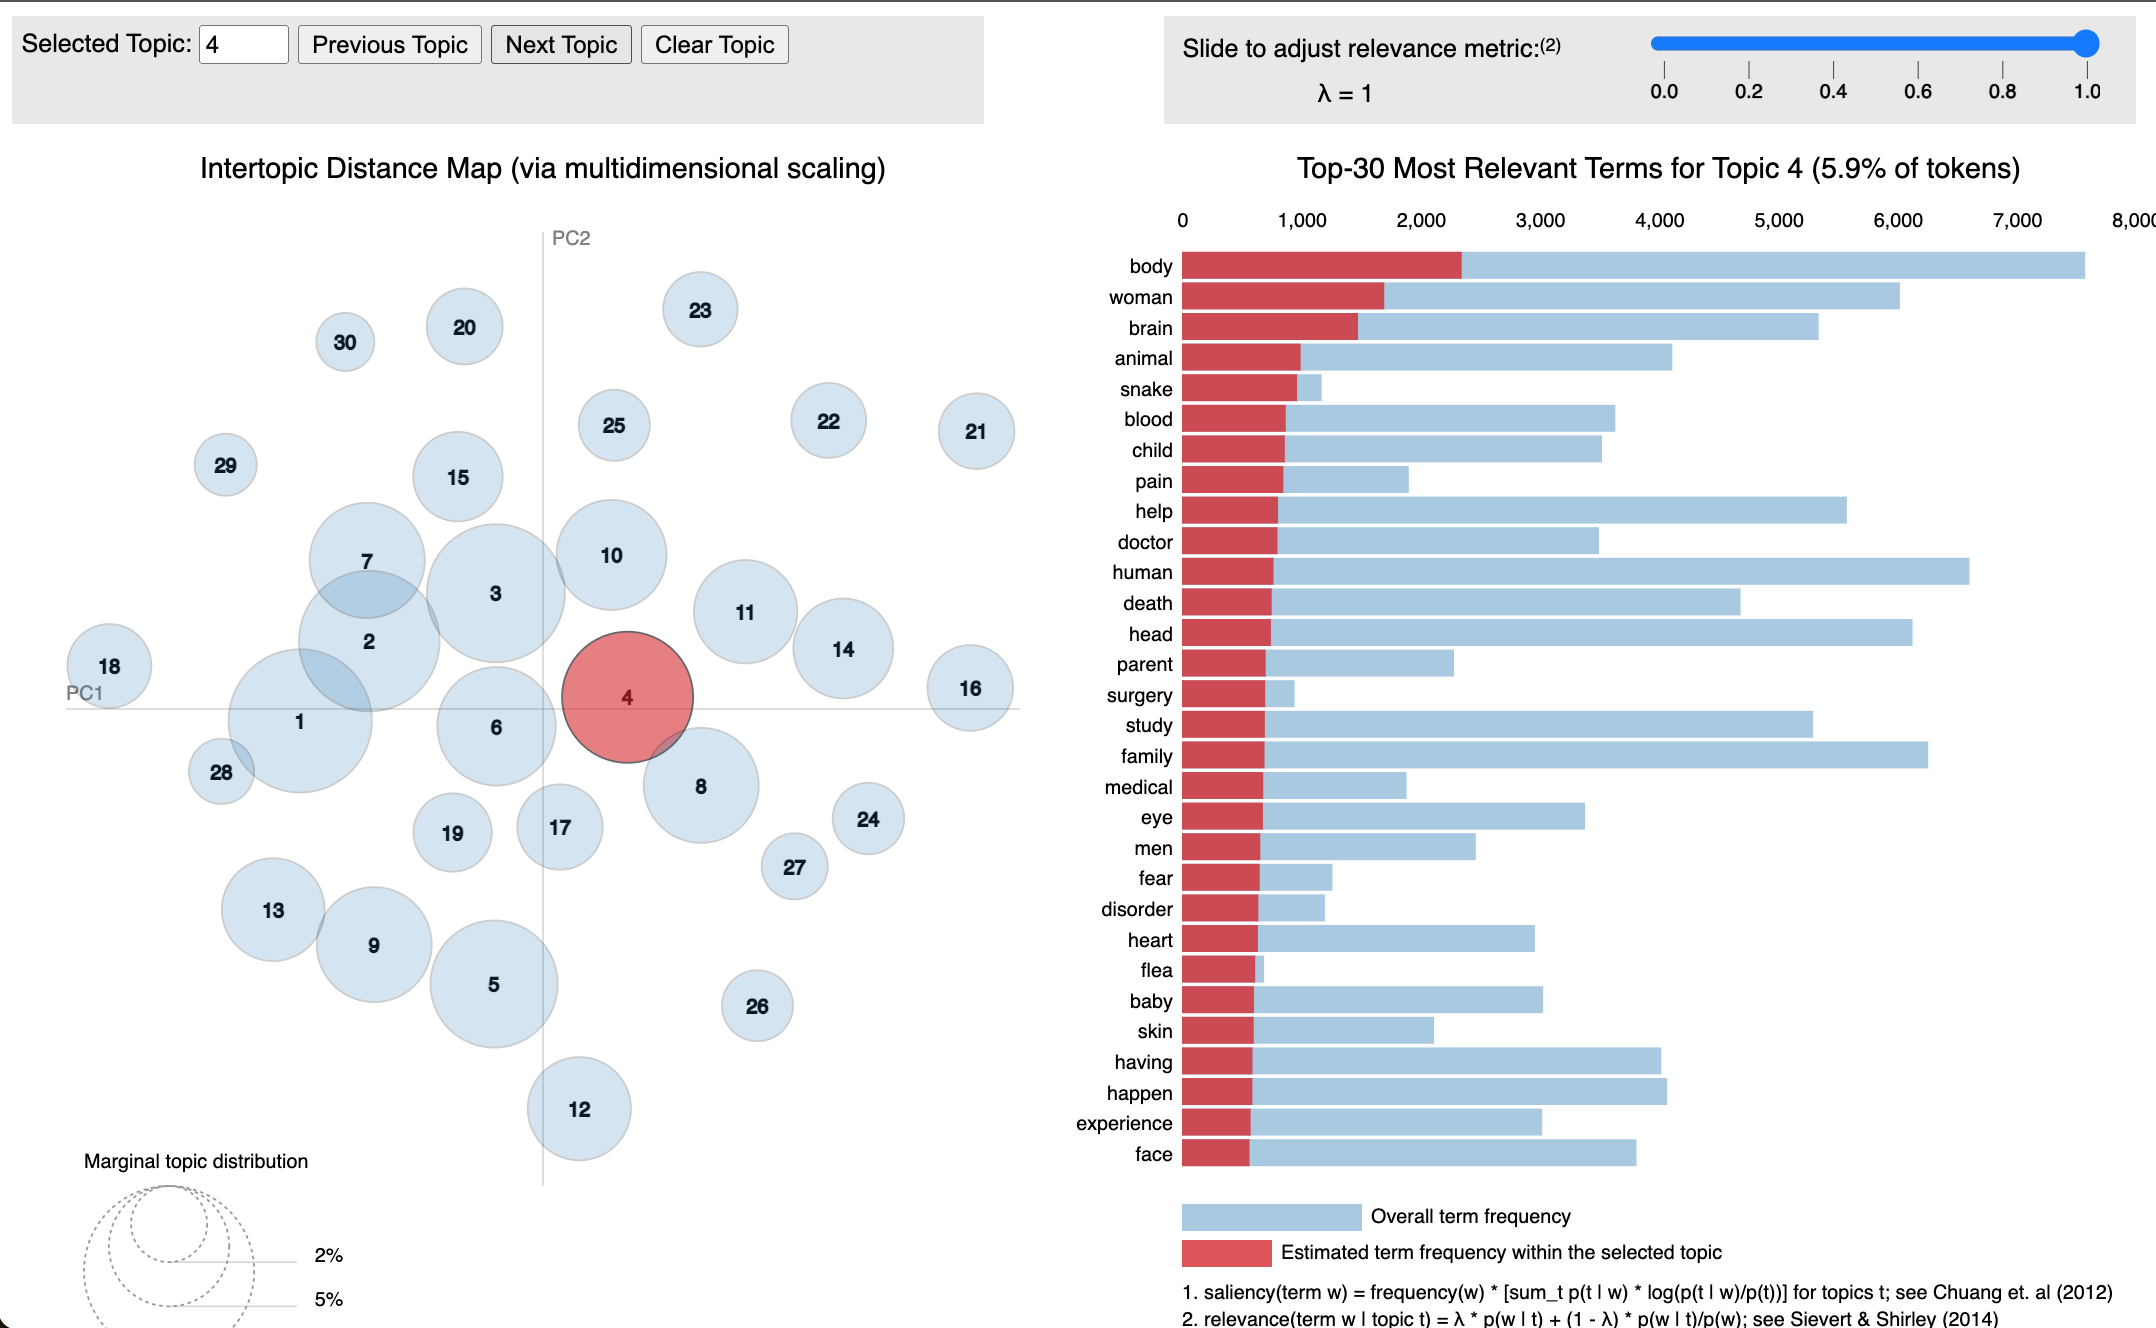
We can see that the algorithm has definitely managed to capture several overarching topics and keywords!
Final Conclusions
This project was primarily to learn more about natural language processing and recommendations using topic modelling. Future work I would like to undertake to build on these results:
- Further hyperparameter tuning, particularly on the sensitivity of removing common and rare words, and gensim’s $alpha$ and $eta$ parameters.
- Host these results on my github pages for people to explore recommendations for themselves, and allow for interactive exploration of the pyLDAvis results.
Oh, and to answer the question on the The Dyatlov Pass Mystery episodes, you should check out:
- How Cannibalism Works
- Where’s the best place on your body to get shot?
- Yeti: The Asian Bigfoot
- Pierson, B. D. (2022, July 30). “Stuff You Should Know” Podcast Transcripts - Full Dataset with Transcript of All Episodes (SYSK_Transcripts). https://doi.org/10.17605/OSF.IO/VM9NT